Distributed applications
Learn about distributed applications, the runtime platform offered by Teracloud Streams, get a runtime environment started, and walk through the distributed application lifecycle.
Concepts
In Stream application basics, a simple HelloWorld application was built and run as a binary program. Running the application this way is called Standalone because it runs on a single host and doesn't require a runtime environment.
An application can also be run in Distributed mode. Distributed applications enable logic to run across one or more hosts, but require a runtime environment to orchestrate the applications and hosts. This approach is beneficial for several reasons:
- Distributes workload
- Enables operators to be scheduled to specific resources
- Monitors health and metrics
- Automatically recovers from app or host failures
Jobs
When you submit a stream application to the runtime environment, it creates a Job which represents your running, distributed application.
Info
Jobs can process continuous streams of data, so they run until you cancel them.
To efficiently distribute processing across available resources, the runtime environment divides a job into one or more Processing Elements (PEs). Each PE is a Linux process that executes one or more operators from your application and communicates data streams to other PEs as necessary.
For more details, see Running applications and Runtime environment overview in the product documentation.
Teracloud Streams runtime platform
Teracloud Streams offers a distributed runtime platform to perform host and application orchestration. The runtime platform exposes APIs and a web UI to assist in platform and application monitoring and management.
Stream's runtime platform is comprised of a Domain and one or more Instances.
To run a distributed application, you need an active Teracloud Streams instance.
Set up a runtime environment
Create and start an instance
Tip
If you're using the QSE container, continue to Configure VS Code. The QSE container automatically creates and starts an instance for you.
For product installs, a Streams instance can be created on a single node or across multiple nodes.
See Creating a basic domain and instance in the product documentation for instructions to set up a basic, single-node instance.
To create an enterprise instance across multiple nodes, complete the following steps:
- Review Setting up an enterprise domain on multiple resources.
- Set up an external ZooKeeper server or cluster.
- Create a domain.
- Add resources to the domain.
- Create and start an instance in the enterprise domain.
Configure VS Code
Tip
If you're not using VS Code, continue to the next section.
To create a job through VS Code, you must configure it to point to your instance:
- Determine your REST API URL
- For QSE environments, use
https://localhost:9714/streams/resources - For product install environments, use the output of
streamtool geturl --api
- For QSE environments, use
- Click the (Streams Explorer) icon in the Activity Bar
- Click the
Add Domainbutton - Enter the REST API URL
- Enter your username
- Enter your password
Create a job by submitting an application
When you compile an SPL application, the compiler creates a standalone binary program as well as a Streams Application Bundle (SAB) under the output/ directory. This bundle can be submitted to a Streams instance to create a job.
For this tutorial, we'll use the SAB compiled from the HelloWorld application in Stream application basics.
Use your favorite interface to submit the SAB to your runtime environment:
- Navigate to SAB file under
output/in the File Explorer - Right-click on the SAB file
- Select
Submit Jobto bring up the submission wizard - Scroll the bottom of the form and click the 'Submit Job' button
The job will appear in the list of jobs under your instance.
Note
If you want to recompile and submit your application all in one step, right-click an SPL file and select Build and Submit Job
- Set up your environment for Streams:
source <streams-install>/bin/streamsprofile.sh - Run
streamtool submitjob <workspace>/output/HelloWorld.sab
The output messages will inform you if the submission was successful or not.
Note
If your submission is successful, the output messages will tell you the Job ID. This ID is useful for other commands going forward.
Monitor the job
Now that a job is created, you can now:
- Monitor job and PE health
- View the job graph
- View metrics
- View or download logs
You can monitor a job using your favorite interface.
Monitor the job and PE health
A job's health is important to monitor and identify if a distributed application is having issues. If any PE in the job is not healthy, then the job will not be healthy.
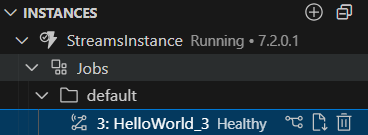
The health of the job appears next to the job name in the Streams Explorer:
Warning
Because VS Code is a developer-first tool, VS Code does not show PE health. Use the Streams Console or the CLI to get PE info if needed.
View the job graph in Streams Console
Streams Console is the Web UI for managing, monitoring, and performing operations on the Streams platform. Additionally, the web UI has application-specific dashboards that allow users to monitor jobs and PEs and also provides a graph representation of the job.
- Navigate to the Streams Explorer
- Navigate to the job you want to see
- Click the 'Show Job Graph' button
- Click Open to automatically open it in a browser
- Sign in using your username and password
- Run
streamtool geturl - Copy the URL from the output
- Open a web browser and go to the URL
- Sign in using your username and password
- Navigate to the Application Dashboard
Info
The job graph also has a color scheme to color the operators based on different factors like what PE or resource it's located in, CPU utilization, and many others.
View or download logs
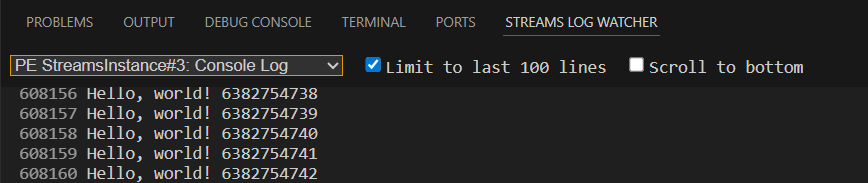
To inspect PE stdout/err output, help debug, or investigate errors, you can view or download job and PE logs.
To view logs directly in VS Code, use the Streams Log Watcher:
- Click the
STREAMS LOG WATCHERtab in the lower right panel
To download the logs:
- Navigate to the Streams Explorer
- Navigate to the job you want to see
- Click the 'Download Job Logs' button
Stop the job
Click the 'Cancel Job' icon next to the job
Run streamtool canceljob <jobId>